Who holds what, and who wants it.
Field Map draws your collectors and artists as one grid: what each collector holds, how sure you are of it, and the interest that is still waiting for a work.
A market view built from your records.
Tap any cell. Shaded cells are holdings, hatched cells are unconfirmed, and ringed cells are interest with nothing yet placed.
That's a sample. We'll show you the full system with records like yours.
Request a full demonstration ↗Built from what you already record.
There is no separate spreadsheet to maintain. The grid draws on sales, contact records and the conversations your team logs.
- Holdings from your sales history and contact records
- Sales imported from Xero, QuickBooks, MYOB or a hand-kept spreadsheet
- Declared interest recorded on each contact, with a price band
- Updates as new sales and notes are added
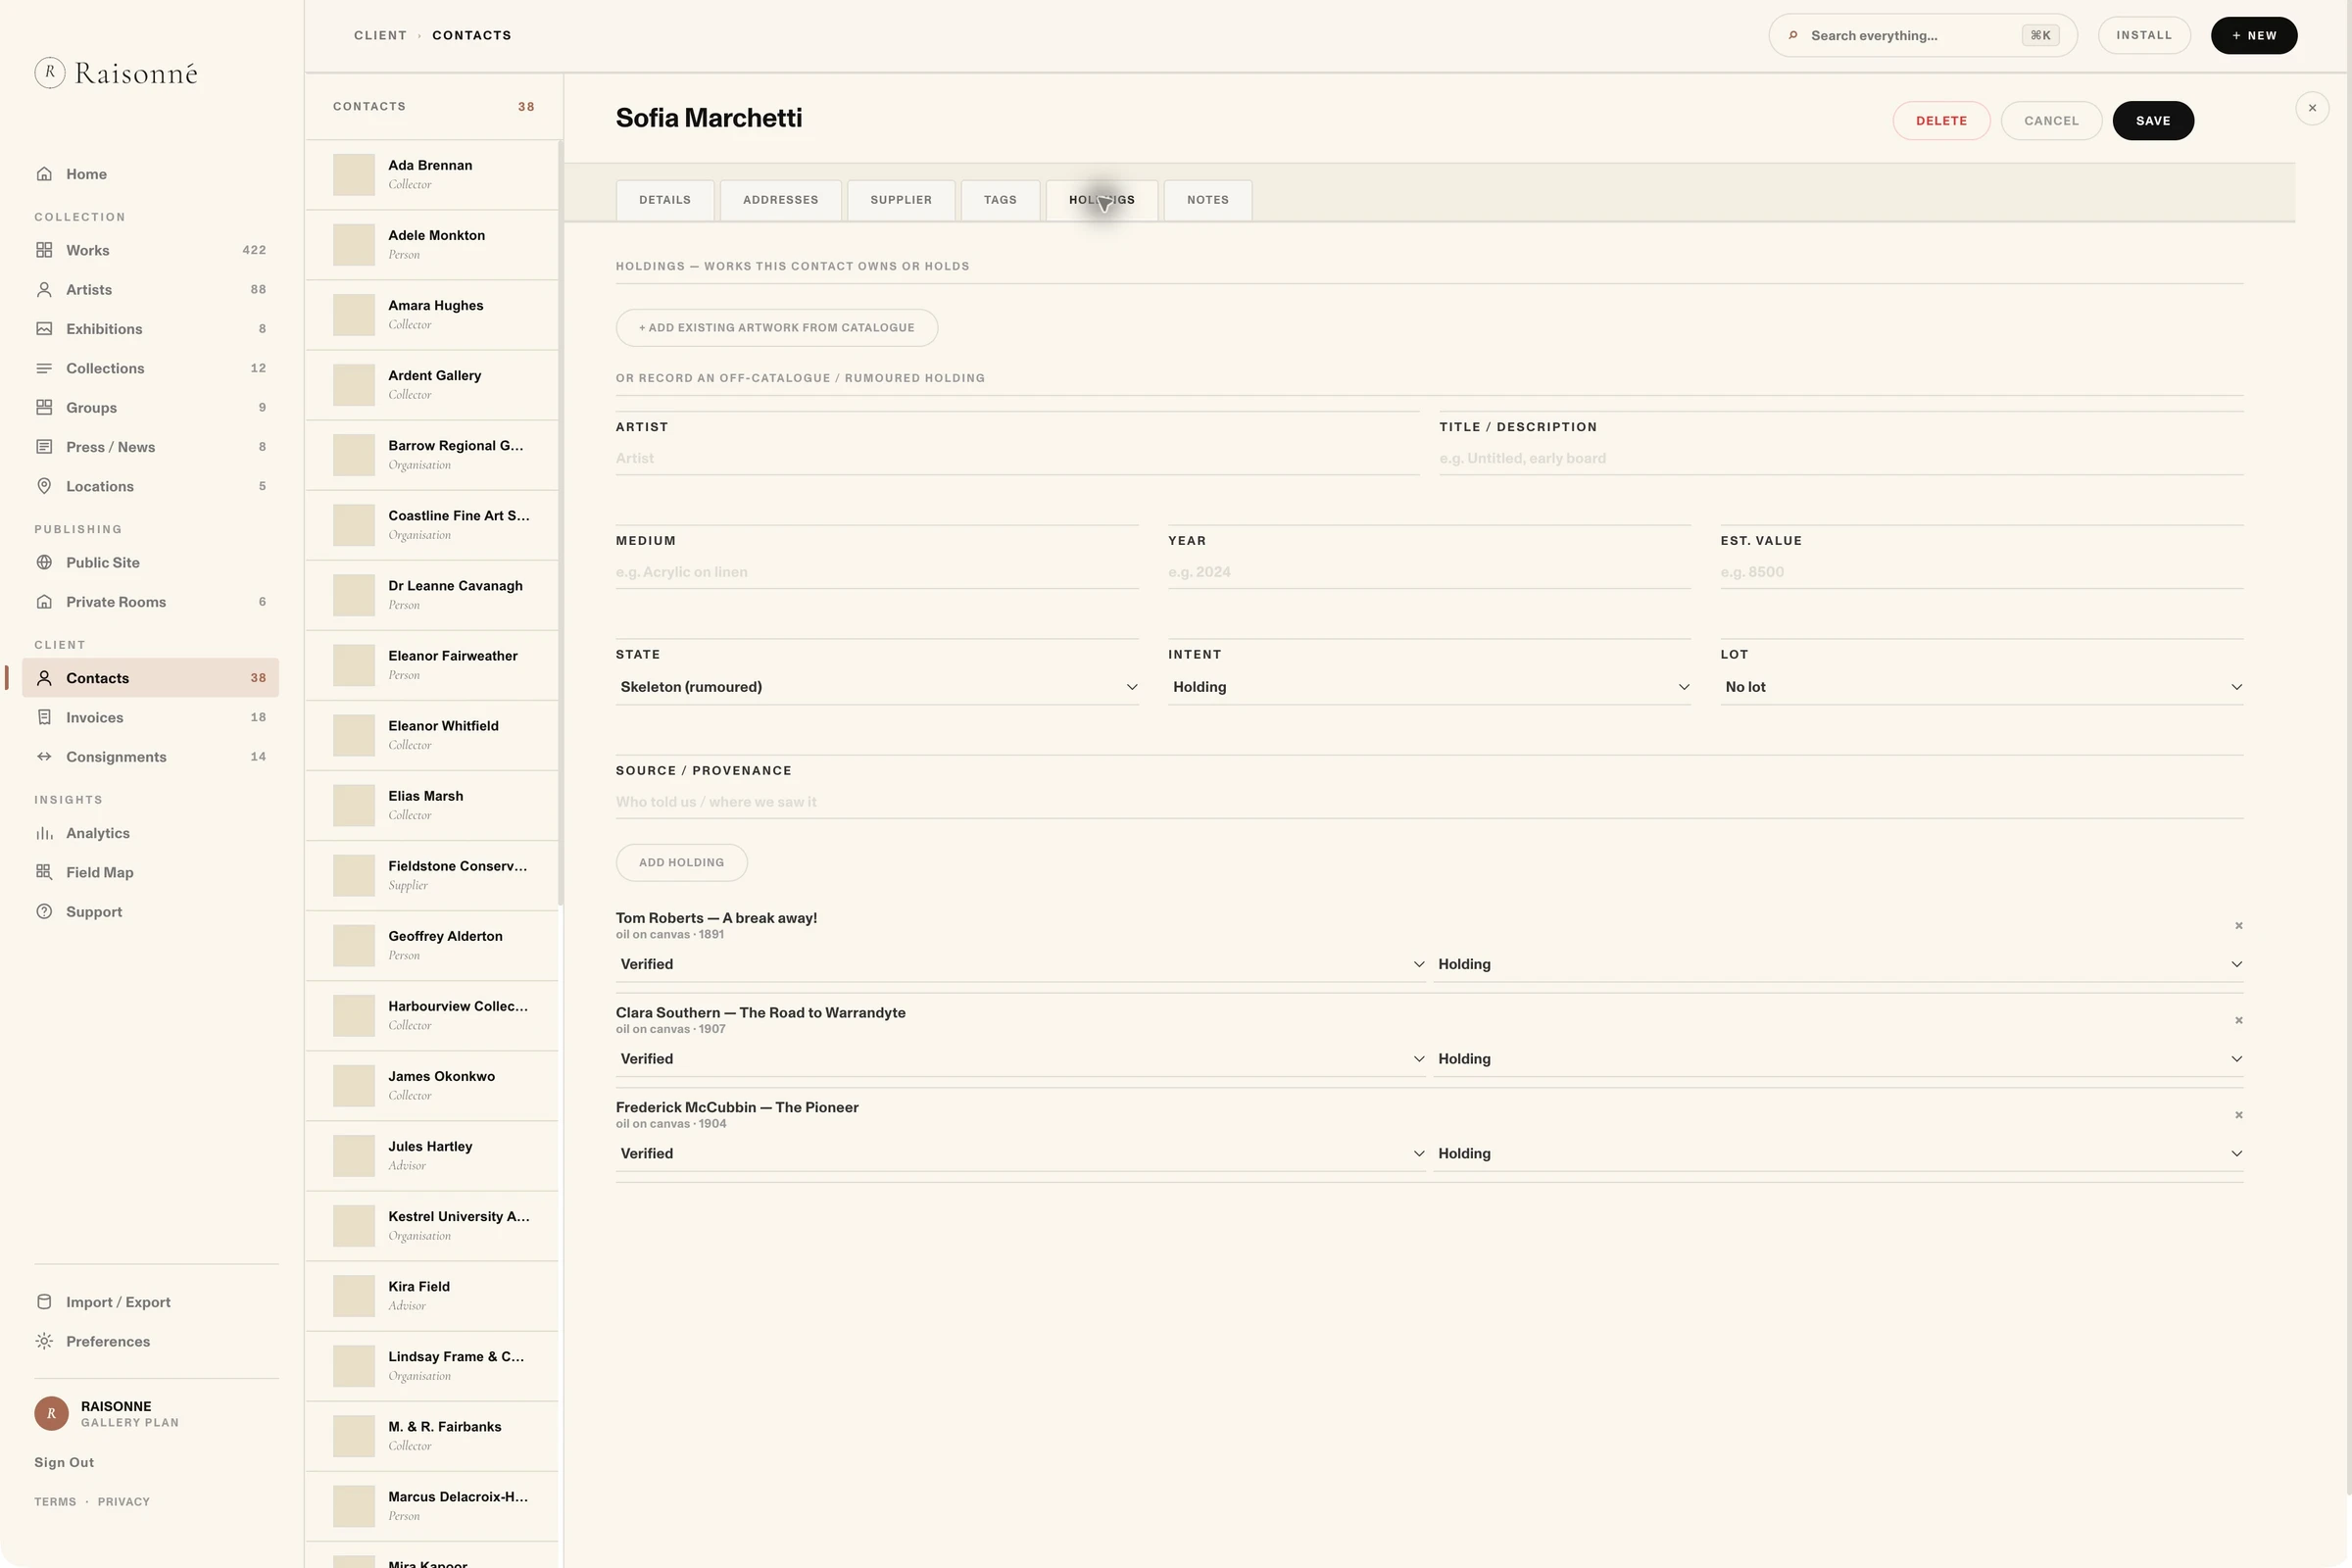
Know how sure you are.
Galleries hear about holdings long before they can prove them. Field Map keeps those leads, and keeps them honest.
- Every holding carries a confidence level: rumoured, seen or verified
- Unconfirmed holdings are shown, never presented as fact
- Drill into any cell for the works, contacts and notes behind it
- Unmet demand becomes a placement lead you can act on
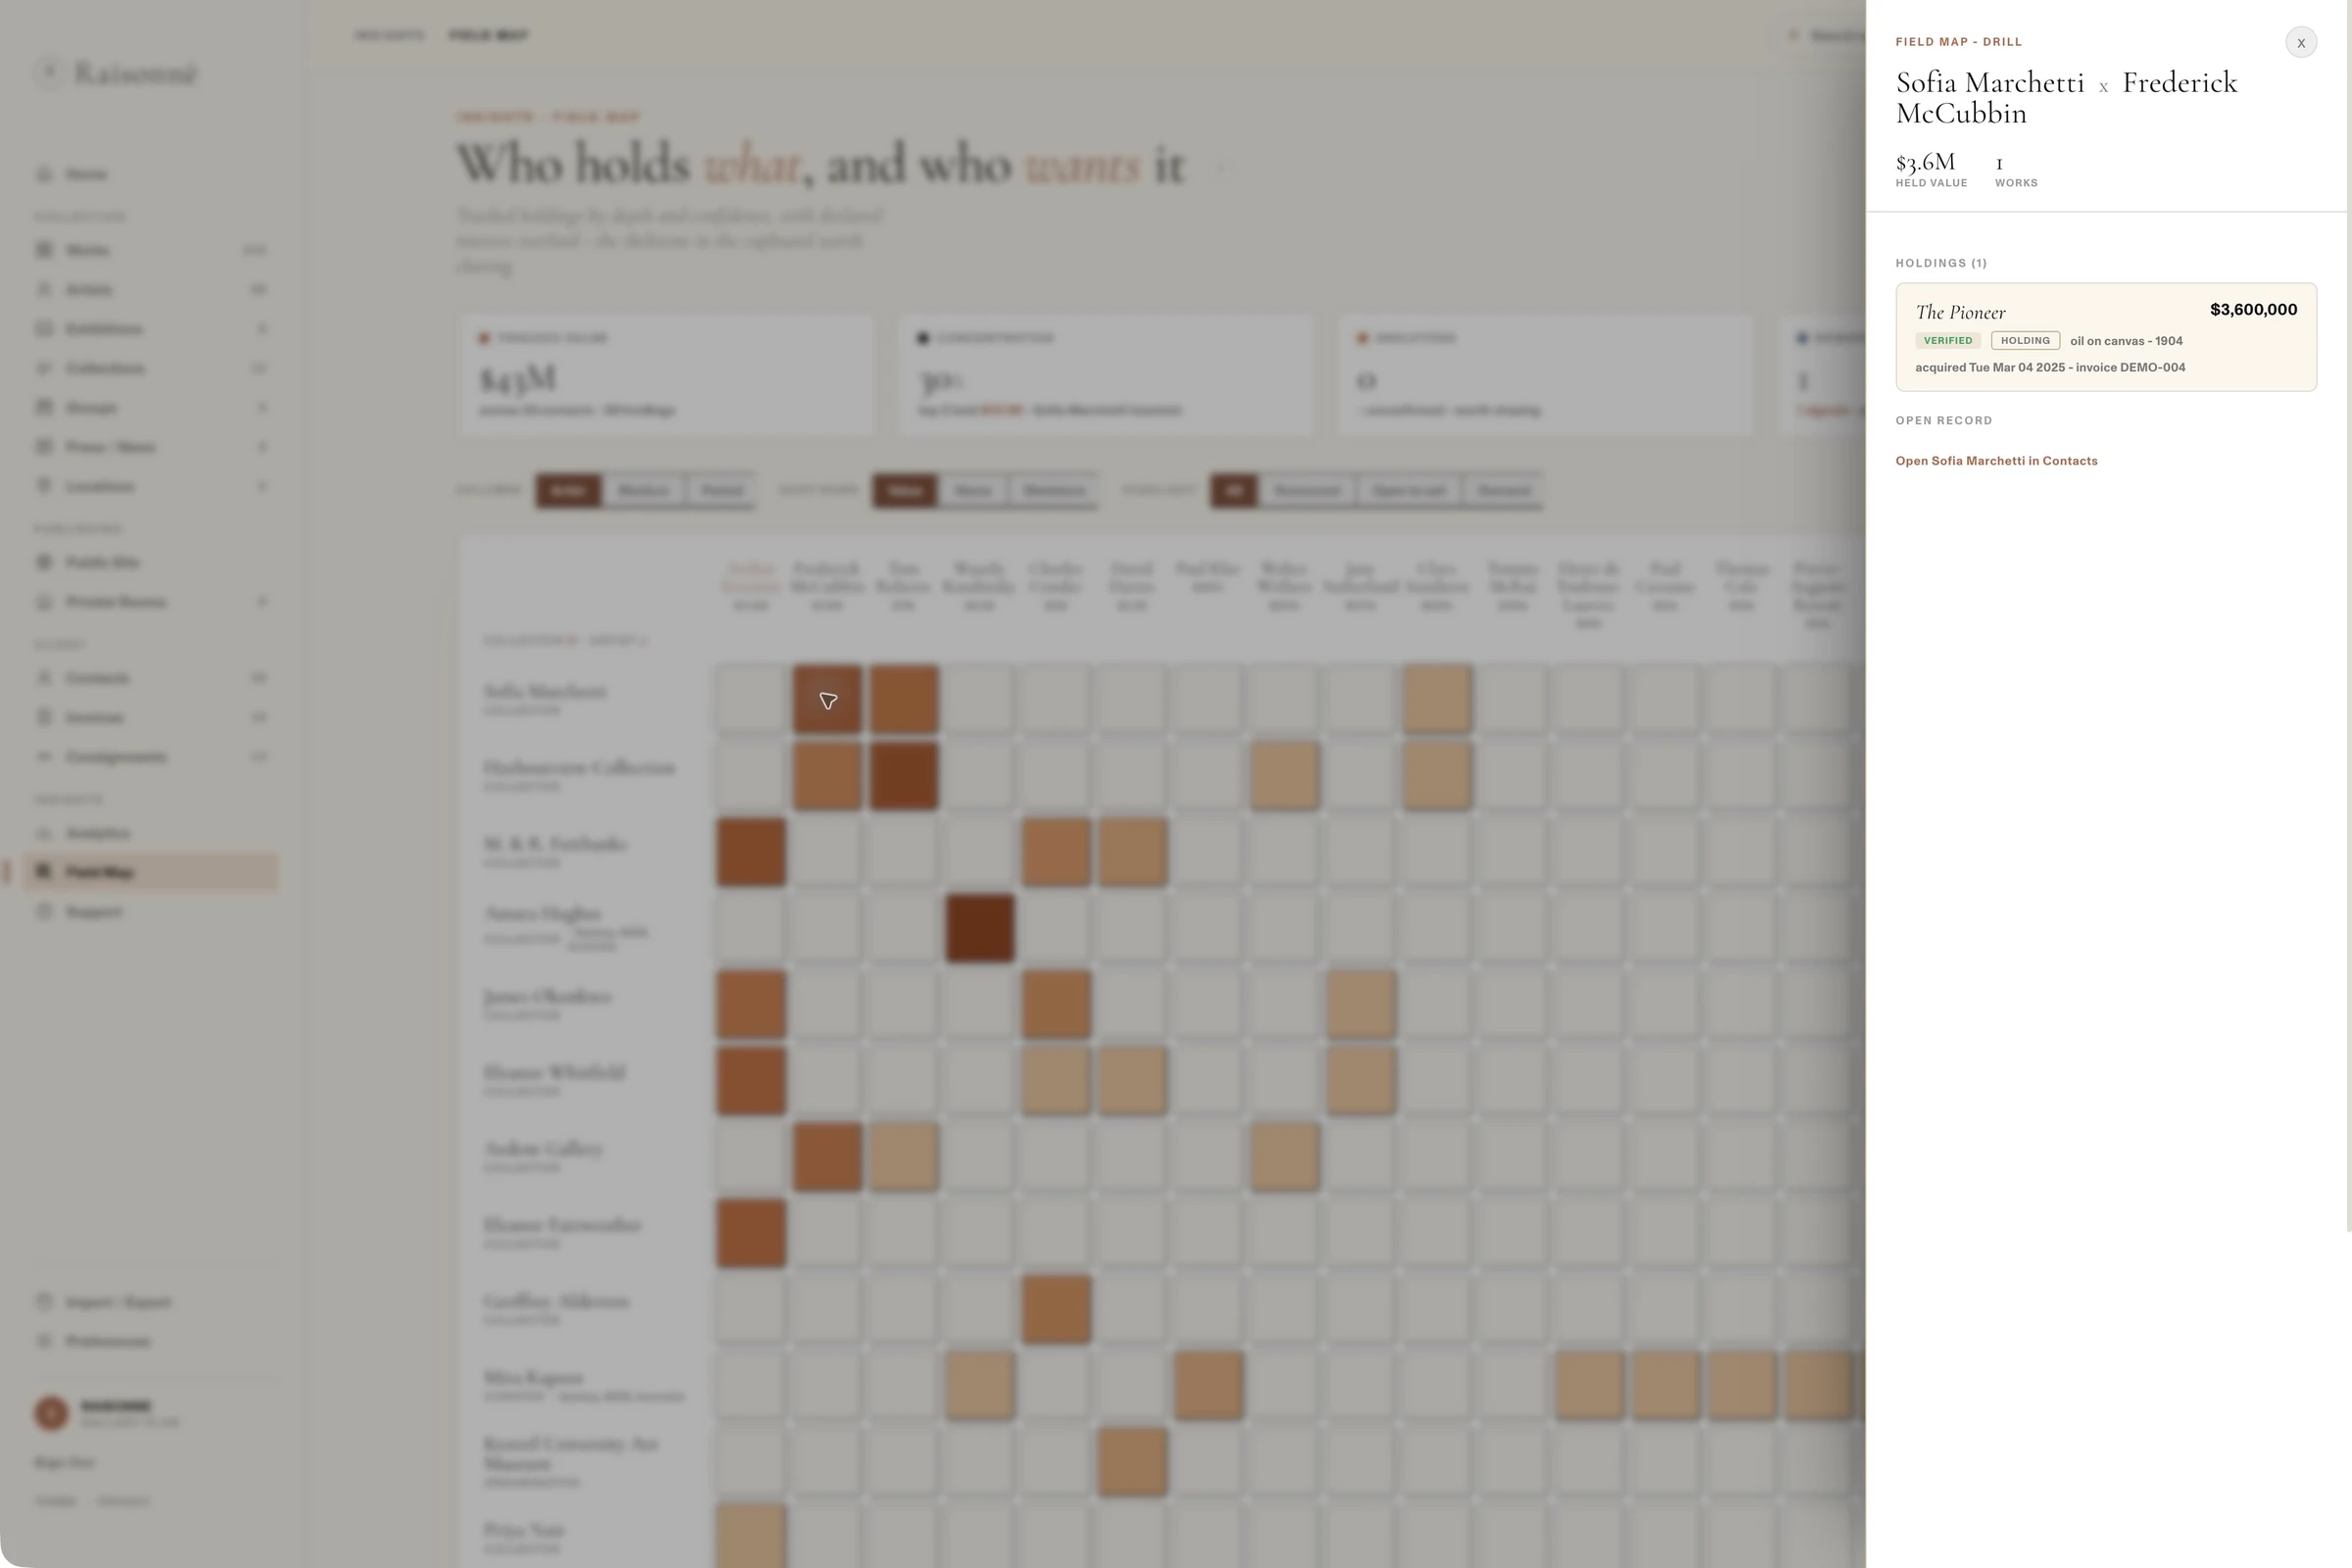
The same view, wherever it helps.
Field Map is one engine, so the same data appears where you need it.
Across the gallery
The full collector × artist grid, sortable by value, confidence or demand.
On an artist page
Who holds this artist, how deeply, and who has asked for their work.
On a contact page
What this collector holds across your programme, and what they want next.
Kept off every public surface.
Field Map is an internal tool. Holdings, buyers and demand never appear on your website, in viewing rooms or through the public API.
Internal by design
Buyer names, reserves and commission are never returned by the API or published anywhere. Field Map is visible only to your signed-in team.
See Field Map with your own history.
Send us a note and we’ll show you how your sales history and contacts would draw as a market map.